It is a portfolio theory, which is a description of how rational investor should build efficient portfolios and select the optimal portfolio.
It desires the relationship between the expected return and risk of individual securities and portfolios in the capital market.
CAPM can be used to identify underpriced and overpriced securities.
Assumptions of CAPM:
- Investors make their investment decisions on the basis of risk-return assumptions
- The purchase and sale of a security can be undertaken in any no.of devisible units.
- There is perfect competition where investors in total determine prices by their actions.
- There are no transaction costs.
- There are no personal taxes.
- The investor can sell short any amount of any share.
- Investors have identical expectations with regard to the decision period and decision points.
Pricing of Securities with CAPM:
- The following formula can be used to the securities with CAPM.
Ri = (P1-Po) + D1 / Po
Where, Po - Current Market Price.
P1 – Estimated market price after one year.
D1 – Dividend for the year.
Ri – Expected Return.
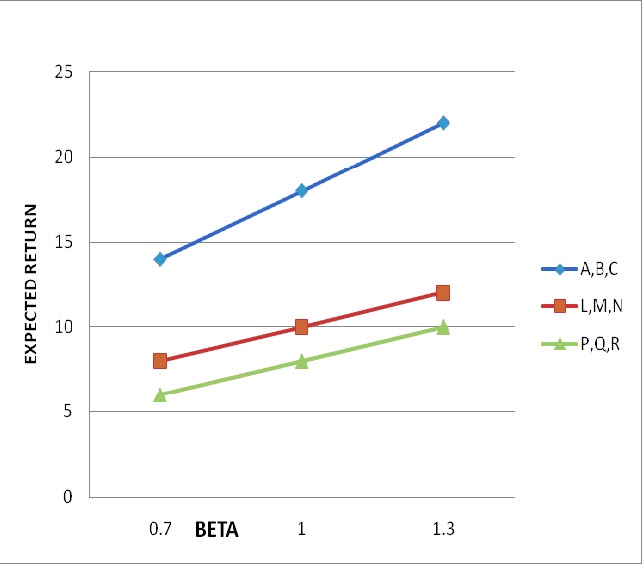
According to this chart
A is under priced because expected return is higher than expected level of risk.
L is correctly priced.
P is overpriced.
I think you can understand more form the following three examples.
EXAMPLE-1
Security | Estimated Returns (in %) | Beta
|
A | 30 | 1.6 |
B | 24 | 1.4 |
C | 18 | 1.2 |
D | 15 | 0.9 |
E | 15 | 1.1 |
F | 12 | 0.7 |
Risk free rate is 10%, Market return is expected to be 18%.
Calculation of expected return on each security using the CAPM equation.
Ri = Rf+ βi (Rm-Rf)
Here Rf=10, Rm=18
A= 10+1.6(18-10)
= 22.8
B= 10+1.4(18-10)
= 21.2
Security | Estimated Returns (in CAPM) | Estimated Returns (in %)
|
A | 22.8 | 30 |
B | 21.2 | 24 |
C | 19.6 | 18 |
D | 17.2 | 15 |
E | 18.8 | 15 |
F | 15.6 | 12 |
Result:
- A & B provide more return than the expected return. So they are underpriced.
- C,D,E,F are overpriced.
EXAMPLE-2
A security pays a dividend of Rs.3.85 and sells currently at Rs.83. The security is expected to sell at Rs.90 at the end of year. The security has a beta of 1.15. the risk free rate is 5% and expected return on market index is 12%.
Assess whether the security is correctly priced.
Soln;
Expected Return
Ri = Rf+ βi (Rm-Rf)
=5+ 1.15(12-5)
=13.05%
Estimated Return
Ri = (P1-Po) + D1 / Po
= (90-83)+3.85/83
= 13.07%
· More or less equal to the expected return, the security can be assessed as correctly priced.
EXAMPLE-3
Security | Estimated Return (%) | Beta | S.D (%) |
A | 30 | 2.0 | 50 |
B | 25 | 1.5 | 40 |
C | 20 | 1.0 | 30 |
D | 11.5 | 0.8 | 25 |
E | 10.0 | 0.5 | 20 |
Mkt Index | 15 | 1.0 | 18 |
Govt. Securities | 7 | 0 | 0 |
a. In terms of the security market line, which of the security listed above are underpriced?
b. Assuming that a portfolio is constructed using equal proportions of the five securities listed above, calculate the expected return and risk of such a portfolio.
Solution
a. We can use CAPM to determine which of the securities listed are underpriced. For this we have to
Calculate the expected return on each security using CAPM equation:
Ri = Rf+ βi (Rm-Rf)
Given that (Govt. Security return rate)=7 and Rm=15
The equation becomes
Ri=7+2(15-7), = 23…..
Security | Estimated Return (%) | Expected Return (CAPM) |
A | 30.0 | 23 |
B | 25.0 | 19 |
C | 20.0 | 15 |
D | 11.5 | 13.4 |
E | 10 | 11 |
According to this table, A, B, C are underpriced
b.To calculate the expected return and risk Rp and βp. We have to calculate βp
As the proportion of investment in each security is equal, ψi = 0.20
βp = (0.2) + {2 + 1.5 + 1 + 0.8 + 0.5}
= 1.16
Expected return of portfolio
Ri = Rf+ βi (Rm-Rf)
= 7+1.16 (15-7)
= 16.28%
Systematic risk of the portfolio βp= 1.16.